Get Plagiarism Free UPES MBA Solved Assignments
UPES Solved Assignments for MBA Semester – 1
Economics & Management Decisions – UPES Solved Assignment
Assignment 1 – Economics & Management Decisions
Consider a scenario where a new technology disrupts the market for a traditional product, such as the introduction of electric vehicles impacting the market for gasoline-powered cars. Using the concepts of demand and supply analysis, analyze the potential effects of this technological innovation on the equilibrium price and quantity in the market for the traditional product.
Assignment 2 – Economics & Management Decisions
Let’s consider a hypothetical manufacturing company, XYZ Widgets Inc., which produces widgets. Initially, the company operates at a small scale, producing 1,000 widgets per month. The total monthly cost (TC) for producing 1,000 widgets is $20,000. This yields an average cost (AC) of $20 per widget.
As XYZ Widgets Inc. expands its production scale, it experiences economies of scale due to factors such as specialization, bulk purchasing discounts, and more efficient use of machinery. Let’s assume that as the company increases its output to 2,000 widgets per month, its total monthly cost decreases to $35,000. Analyze cost according to Economies of Scale.

Financial Management – UPES Solved Assignment
Assignment 1 | Financial Management
The summarized balance sheet of C.B. Ltd. on March 31, 2022 is provided below:
|
Liabilities |
Amount (Rs) |
Assets |
Amount (Rs) |
|
Equity capital |
2,00,000 |
Fixed assets |
1,40,000 |
|
Reserves and surplus |
30,000 |
Cash |
12,000 |
|
Sundry creditors |
70,000 |
Debtors |
93,000 |
|
Inventories |
55,000 |
||
|
|
3,00,000 |
|
3,00,000 |
Other information:
Sales 2,60,000
(-) Cost of goods sold (1,80,000)
Gross profit 80,000
(-) Administration and other expenses (62,500)
Net profit 17,500
You are required to compute the following ratios:
-
- Current ratio
- Quick ratio
- Inventory turnover ratio
- Debtor’s turnover ratio
- Net profit ratio
- Sales to total asset ratio
Note: Proper calculations are required in all ratios, and you can make the necessary assumptions.
Assignment 2 | Financial Management
In this assignment, you will explore the significance of working capital in a firm’s liquidity and profitability. You will analyze how effective management of working capital impacts a firm’s financial stability and growth. By the end of this assignment, you will have a deeper understanding of the role of working capital in ensuring the firm’s success.
Instructions
Introduction
- Provide an overview of the importance of working capital in the financial management of a firm.
- Explain the relationship between working capital, liquidity, and profitability, and their significance in the firm’s success.
Working Capital Definition and Components
- Define working capital and explain its components, including current assets and current liabilities.
- Discuss the key elements of working capital management, such as inventory, accounts receivable, and accounts payable.
Role of Working Capital in Firm’s Liquidity
- Explain the concept of liquidity and its importance for a firm.
- Discuss how working capital affects a firm’s liquidity by ensuring the availability of funds to meet short-term obligations.
- Enumerate the factors that influence working capital requirements for maintaining liquidity.
Role of Working Capital in Firm’s Profitability
- Explain the relationship between working capital and profitability.
- Discuss how efficient management of working capital can enhance profitability by optimizing cash flows and minimizing costs.
- Highlight the strategies and techniques used to manage working capital effectively to improve profitability.
Case Study Analysis
- Present a real-world case study or scenario that illustrates the impact of working capital on a firm’s liquidity and profitability.
- Analyze the case study and identify the specific working capital management practices that contributed to the firm’s success or failure.
- Discuss the outcomes and lessons learned from the case study in terms of liquidity and profitability.
Conclusion
- Summarize the key points discussed in the assignment.
- Emphasize the crucial role of working capital in ensuring a firm’s liquidity and profitability.
- Reflect on the implications of effective working capital management for the firm’s financial stability and growth.
Note: Your assignment will be evaluated based on the following criteria:
- Clear understanding and explanation of working capital and its components
- Comprehensive discussion of the role of working capital in firm’s liquidity and profitability
- Application of relevant theories and concepts to support arguments
- Analysis and interpretation of the provided case study or scenario
- Logical structure and organization of the assignment
- Use of appropriate terminology and examples
- Clarity, coherence, and effectiveness of written communication
For Plagiarism Free UPES MBA Solved Assignments Contact us at +91- 9911899400
Operations Management – UPES Solved Assignment
Assignment 1 Operations management
The data of demand for a product for the previous 24 months is presented in the graph below.
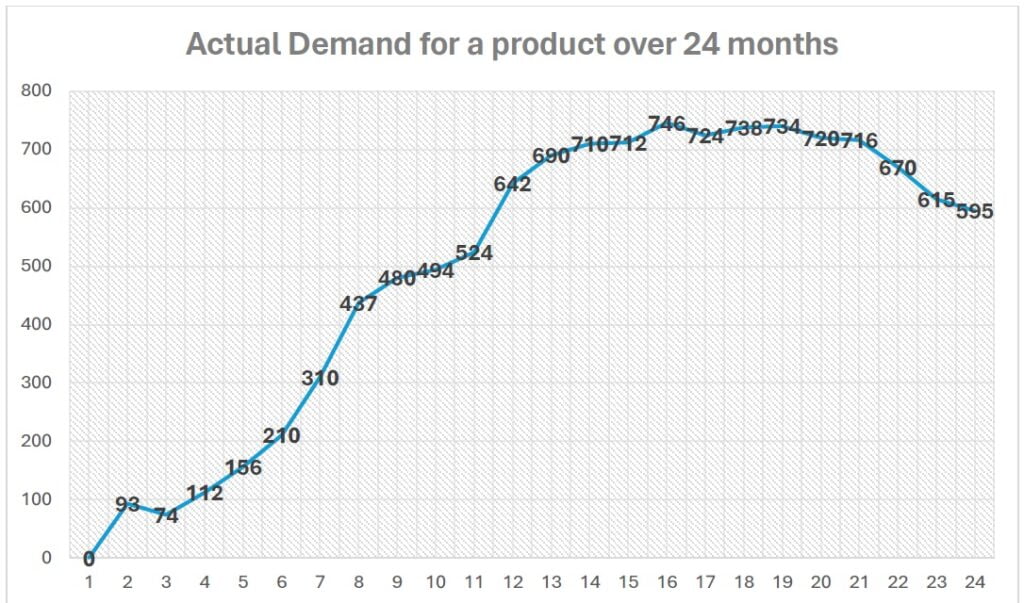
- Using period 3 to 10, develop a regression for forecast. Check accuracy of the forecasting equation for period 11 to 16.
- Using period 19 to 24, develop a forecast for period 25.
- Explain the demand pattern in the context of product life cycle.
Assignment 2 – Operations & Material Management
A spare part in a manufacturing company is vital for operations. However, the part is very costly and being an imported part, its lead-time is a couple of months. The life of this part, when put to use, has been observed from 3 months to 18 months. The company has faced tremendous losses in recent past because of unavailability of this part in time. As a materials manager, how will you deal with the inventory management of this part? What type of inventory control system you would like to use for this part?
For Plagiarism Free UPES MBA Solved Assignments Contact us at +91- 9911899400
Marketing Management – UPES Solved Assignment
Assignment 1 – Marketing Management
Assignment 1: Delivering Customer Value
Instructions:
In this assignment, you will assume the role of a marketing manager for a fictional company, “Tech-Rev,” which specializes in consumer electronics. Your task is to develop a comprehensive plan for delivering exceptional customer value in a highly competitive market.
Background:
Tech-Rev has been facing stiff competition in the consumer electronics market. While the company produces high-quality products, customer loyalty has been decreasing, and market share is eroding due to intense competition from other brands. The company’s leadership has recognized the need to refocus on delivering exceptional customer value as a key differentiator.
Assignment Task:
Your assignment is to outline a strategy for Tech-Rev to deliver superior customer value in a way that not only retains existing customers but also attracts new ones. The plan should encompass various aspects, including product development, marketing, customer service, and post-purchase support.
Key Components of the Assignment:
- Customer Segmentation: Identify and describe the key customer segments for Tech-Rev’s products. Who are the primary customers, and what are their needs and preferences?
- Value Proposition: Develop a clear and compelling value proposition for Tech-Rev. What unique value will the company provide to each customer segment?
- Product and Service Enhancement: Suggest ways to improve existing products and services to better align with customer needs and preferences. Consider features, quality, design, and pricing.
- Marketing and Communication: Outline a marketing and communication strategy to effectively convey the value proposition to target customers. Include channels, messaging, and promotional activities.
- Customer Engagement: Describe how Tech-Rev can engage with customers throughout their buying journey. This includes pre-purchase, purchase, and post-purchase interactions.
- Feedback Mechanisms: Develop a plan for collecting and utilizing customer feedback to continuously improve products and services.
- Loyalty Programs: Propose a customer loyalty program or retention strategy that rewards and incentivizes long-term customers.
- Employee Training: Discuss the importance of training employees to understand and deliver on the company’s value proposition.
- Measuring Success: Specify key performance indicators (KPIs) to evaluate the success of Tech-Rev’s value delivery strategy.
Submission Instructions:
- Your assignment should be a well-organized document, preferably in a report format.
- Use clear headings for each section.
- Ensure that your plan is detailed, comprehensive, and practical.
- Cite any sources or references used.
- Submit your assignment by [Insert Submission Deadline].
- If necessary, include appendices, charts, or diagrams to support your plan.
Grading Criteria:
Your assignment will be evaluated based on the thoroughness of your plan, the creativity and effectiveness of your strategies, and your ability to demonstrate how TechRev can successfully deliver customer value in a highly competitive market.
Assignment 2 – Marketing Management
Assignment 2: Relationship Marketing
Instructions:
In this assignment, you will explore the concept of relationship marketing and its application in a practical context. You will assume the role of a marketing consultant for a real-world client and provide recommendations on how to enhance their relationship marketing efforts.
Background:
Your client is “Green-Life Grocery,” a mid-sized, eco-conscious grocery store known for its organic products and commitment to sustainable practices. The company has a loyal customer base but is facing growing competition from larger grocery chains. They are seeking to strengthen customer relationships to retain existing customers and attract new ones.
Assignment Task:
Your task is to develop a relationship marketing plan for Green-Life Grocery. Your plan should focus on enhancing customer loyalty and satisfaction by leveraging relationship marketing principles.
Key Components of the Assignment:
- Customer Segmentation: Identify different customer segments that Green-Life Grocery serves. Consider demographics, shopping behaviour, and motivations.
- Customer Profiling: Create detailed profiles for the most valuable customer segments, including their needs, preferences, and pain points.
- Personalization: Propose strategies for personalizing the customer experience, such as personalized recommendations, discounts, or communication.
- Communication Channels: Suggest the most effective communication channels for Green-Life Grocery to engage with its customers. Consider both online and offline channels.
- Loyalty Programs: Develop a loyalty program tailored to different customer segments, emphasizing rewards, incentives, and retention strategies.
- Community Engagement: Outline a plan for Green-Life Grocery to engage with the local community and foster a sense of belonging among customers.
- Feedback Mechanisms: Describe how the company can collect and utilize customer feedback to improve its products and services.
- Data Management: Discuss how the company can effectively collect, analyse, and leverage customer data to enhance relationship marketing.
- Employee Training: Explain the importance of training employees to provide excellent customer service and build lasting relationships.
- Measuring Success: Specify key performance indicators (KPIs) to evaluate the effectiveness of Green-Life Grocery’s relationship marketing efforts.
Submission Instructions:
- Your assignment should be well-structured and written in a report format.
- Clearly label sections and use headings for each component.
- Ensure that your recommendations are practical and actionable.
- Cite any sources or references used.
- Submit your assignment by [Insert Submission Deadline].
- You may include appendices, customer personas, or any other relevant supporting materials.
Grading Criteria:
Your assignment will be assessed based on the thoroughness and practicality of your relationship marketing plan, the creativity of your recommendations, and your ability to demonstrate how GreenLife Grocery can build stronger relationships with its customers in the competitive grocery market.
For Plagiarism Free UPES MBA Solved Assignments Contact us at +91- 9911899400
Quantitative Techniques for Management Applications – UPES Solved Assignment
Assignment 1 | Quantitative Techniques for Management Applications
Forecasting
The Akron Zoological Park
During the late 1980s, global changes in consumer preferences for radial tires, inflation, and changes in governmental priorities, almost resulted in the permanent closing of the Akron Children’s Zoo. Lagging attendance and a low membership level did not help matters. Faced with uncertain prospects, the city of Akron opted out of the zoo business. In response, the Akron Zoological Park was organized as a corporation to operate the zoo under contract with the city.
Annual Attendance at the Akron Zoological Park
|
|
|
Admission Fee ($) |
||
|
Year |
Total Persons |
Adult |
Child |
Group |
|
1998 |
117,874 |
4.00 |
2.50 |
1.50 |
|
1997 |
125,363 |
3.00 |
2.00 |
1.00 |
|
1996 |
126,853 |
3.00 |
2.00 |
1.50 |
|
1995 |
108,363 |
2.50 |
1.50 |
1.00 |
|
1994 |
133,762 |
2.50 |
1.50 |
1.00 |
|
1993 |
95,504 |
2.00 |
1.00 |
.50 |
|
1992 |
63,034 |
1.50 |
.75 |
.50 |
|
1991 |
63,853 |
1.50 |
.75 |
.50 |
|
1990 |
61,417 |
1.50 |
.75 |
.50 |
|
1989 |
53,353 |
1.50 |
.75 |
.50 |
To be successful, the zoo must maintain its image as a quality place for its visitors to spend their time. Its animal exhibits are clean and neat. The animals, birds, and reptiles look well cared for. As resources become available for construction and continuing operations, the zoo also keeps adding new exhibits and activities. The independent organization’s efforts seem to be working, because attendance increased from 53,353 in 1989 to an all-time record of 133,762 in 1994.
Due to its northern climate, the zoo’s open season lasts from mid-April until mid-October. It reopens for 1 week at Halloween and for the month of December. Zoo attendance depends largely on the weather. For example, attendance was down during the month of December 1995, which established many local records for the coldest temperature and the most snow. Variations in weather also affect crop yields and prices of fresh animal foods, thereby influencing the costs of animal maintenance.
In normal circumstances, the zoo may be able to achieve its target goal and attract an annual attendance equal to 40% of its community. Akron has not grown appreciably during the past decade. But the zoo became known as an innovative community resource, and as indicated in the table, annual paid attendance has doubled. Approximately 35% of all visitors are adults. Children account for one half of the paid attendance. Group admissions remain a constant 15% of attendance.
The zoo does not have an advertising budget. To gain exposure in its market, it depends on public service announcements, the zoo’s public television series, and local press coverage of its activities. Many of these activities are only a few years old and are a strong reason why attendance has increased.
Although the zoo is a nonprofit organization, it must ensure that its income sources equal or exceed operating and physical plant costs. Its continued existence remains totally dependent on its ability to generate revenues while reducing its expenses.
Assignment Description
In this assignment, you will analyze the revenue generation and cost management strategies of the Akron Zoological Park. The zoo faced significant challenges in the late 1980s but managed to turn its fortunes around through innovative approaches. Your task is to evaluate the factors influencing the zoo’s attendance, revenue sources, and cost management practices.
Instructions
Introduction
- Provide a brief overview of the Akron Zoological Park and the challenges it faced in the late 1980s.
- Highlight the importance of revenue generation and cost management for the zoo’s continued existence.
Factors Influencing Attendance
- Analyze the factors that affect the zoo’s attendance, such as changes in consumer preferences, inflation, and governmental priorities.
- Discuss the significance of maintaining a quality image through clean and well-cared-for animals, new exhibits, and activities.
- Examine the impact of weather variations on attendance and the zoo’s seasonal operating schedule.
Revenue Generation
- Explain the sources of revenue for the Akron Zoological Park.
- Discuss the importance of community support and the zoo’s reputation as an innovative community resource in attracting visitors.
- Evaluate the effectiveness of the zoo’s marketing and promotional strategies, considering its reliance on public service announcements, television series, and local press coverage.
Cost Management
- Outline the cost management practices implemented by the zoo.
- Discuss the importance of aligning income sources with operating and physical plant costs.
- Analyze the challenges faced by the zoo in reducing expenses while ensuring its continued existence as a non-profit organization.
Financial Performance
-
- Analyze the growth in attendance and revenue over the years, as indicated in the provided table.
- Evaluate the zoo’s ability to achieve its target goal of attracting 40% of its community annually.
- Discuss the significance of maintaining a balanced financial performance for the sustainability of the Akron Zoological Park.
Conclusion
- Summarize the key points discussed in the assignment, including the factors influencing attendance, revenue generation strategies, and cost management practices.
- Emphasize the importance of effective revenue generation and cost management for the long-term success and sustainability of the zoo.
Note: Your assignment will be evaluated based on the following criteria:
- Comprehensive understanding of the factors influencing attendance and revenue generation at the Akron Zoological Park
- Evaluation of the effectiveness of marketing and promotional strategies
- Analysis of cost management practices and their alignment with revenue sources
- Accurate interpretation and analysis of the provided table on annual attendance
- Demonstration of critical thinking and analysis in discussing the financial performance of the zoo
- Use of relevant terminology and concepts
- Structure, organization, and coherence of the assignment
- Clarity, effectiveness, and accuracy of written communication
Assignment 2 | Quantitative Techniques for Management Applications
The North-South Airline
In 2002, Northern Airlines* merged with Southeast Airlines to create the fourth-largest U.S. carrier. The new North-South Airline inherited both an aging fleet of Boeing 737–200 aircraft and Stephen Ruth. Ruth was a tough former secretary of the navy who stepped in as the new president and chairman of the board.
Ruth’s first concern in creating a financially solid company was maintenance costs. In the airline industry, it was commonly believed that maintenance costs rise with the age of the aircraft. Ruth quickly noticed that, historically, there had been a significant difference in reported B737–200 maintenance costs (from ATA Form 41s) both in the airframe and engine areas between Northern Airlines and Southeast Airlines, with Southeast having the newer fleet.
On November 12 2002, Ruth assigned Peg Young, Vice President for operations and maintenance, to study the issue. Specifically, Ruth wanted to know the following:
(1) Whether the average fleet age was correlated to direct airframe maintenance costs, and
(2) Whether there was a relationship between the average fleet age and direct engine maintenance costs.
Young was expected to report back with the answer, along with quantitative and graphical descriptions of the relationship, by November 26 2002.
First, Young had her staff construct the average age of Northern and Southeast B737-200 fleets, by quarter, since the introduction of the aircraft to service by each airline in late 1994 and early 1995. Each fleet’s average age was calculated by first multiplying the total number of calendar days that each aircraft had been in service at the pertinent point in time by the average daily utilization of the respective fleet to the total fleet hours flown. The total number of fleet hours flown was then divided by the number of aircraft in service at that time, giving the age of the “average” aircraft in the fleet.
The average utilization was found by taking the actual total fleet hours flown on September 30 2001, from Northern and Southeast data, and dividing it by the total days in service for all aircraft at that time. The average utilization for Southeast was 8.3 hours per day, and the average utilization for Northern was 8.7 hours per day. Because the available cost data were calculated for each yearly period ending at the end of the first quarter, the average fleet age was calculated at the same points in time.
The fleet data is shown in the following table. Airframe cost data and engine cost data are both shown paired with the average fleet age.
Northern Airlines Data South-east Airlines Data
|
Year |
Airframe cost per aircraft |
Engine Cost per aircraft |
Average age hours |
Airframe cost per aircraft |
Engine Cost per aircraft |
Average age hours |
|
1995 |
$51.80 |
$43.49 |
6512 |
$13.29 |
$18.86 |
5107 |
|
1996 |
54.92 |
38.58 |
8404 |
25.15 |
31.55 |
8145 |
|
1997 |
69.70 |
51.48 |
11077 |
32.18 |
40.43 |
7360 |
|
1998 |
68.90 |
58.72 |
11717 |
31.78 |
22.10 |
5773 |
|
1999 |
63.72 |
45.47 |
13275 |
25.34 |
19.69 |
7150 |
|
2000 |
84.73 |
50.26 |
15215 |
32.78 |
32.58 |
9364 |
|
2001 |
78.74 |
79.60 |
18390 |
35.56 |
38.07 |
8259 |
Dates and names of airlines and individuals have been changed in this case to maintain confidentiality. The data and issues described here are actual.
DISCUSSION QUESTION
Prepare Peg Young’s response to Stephen Ruth
For Plagiarism Free UPES MBA Solved Assignments Contact us at +91- 9911899400